Introduction
This package implements a convenient heatmap plotting package in python. It offers low level functions for
- Plotting
Heatmaps
Dendrograms
Annotations
Legends
Figure layouting
Clustered heatmap

Grouped clustered heatmap

Figure layout
The hmap package comes with a module for defining the layout of a figure using absolute length measurements. Currently the only unit supported is milimeters. The layout of a figure is defined as a grid. You have to specify
the number of rows,
the number of columns,
the widths of the columns,
the heights of the rows,
the vertical distance between adjacent rows,
the horizontal distance between adjacent columns,
the size of the bottom border margin,
the size of the top border margin,
the size of the left border margin, and
the size of theright border margin
As said before, the sizes are given in milimeters.
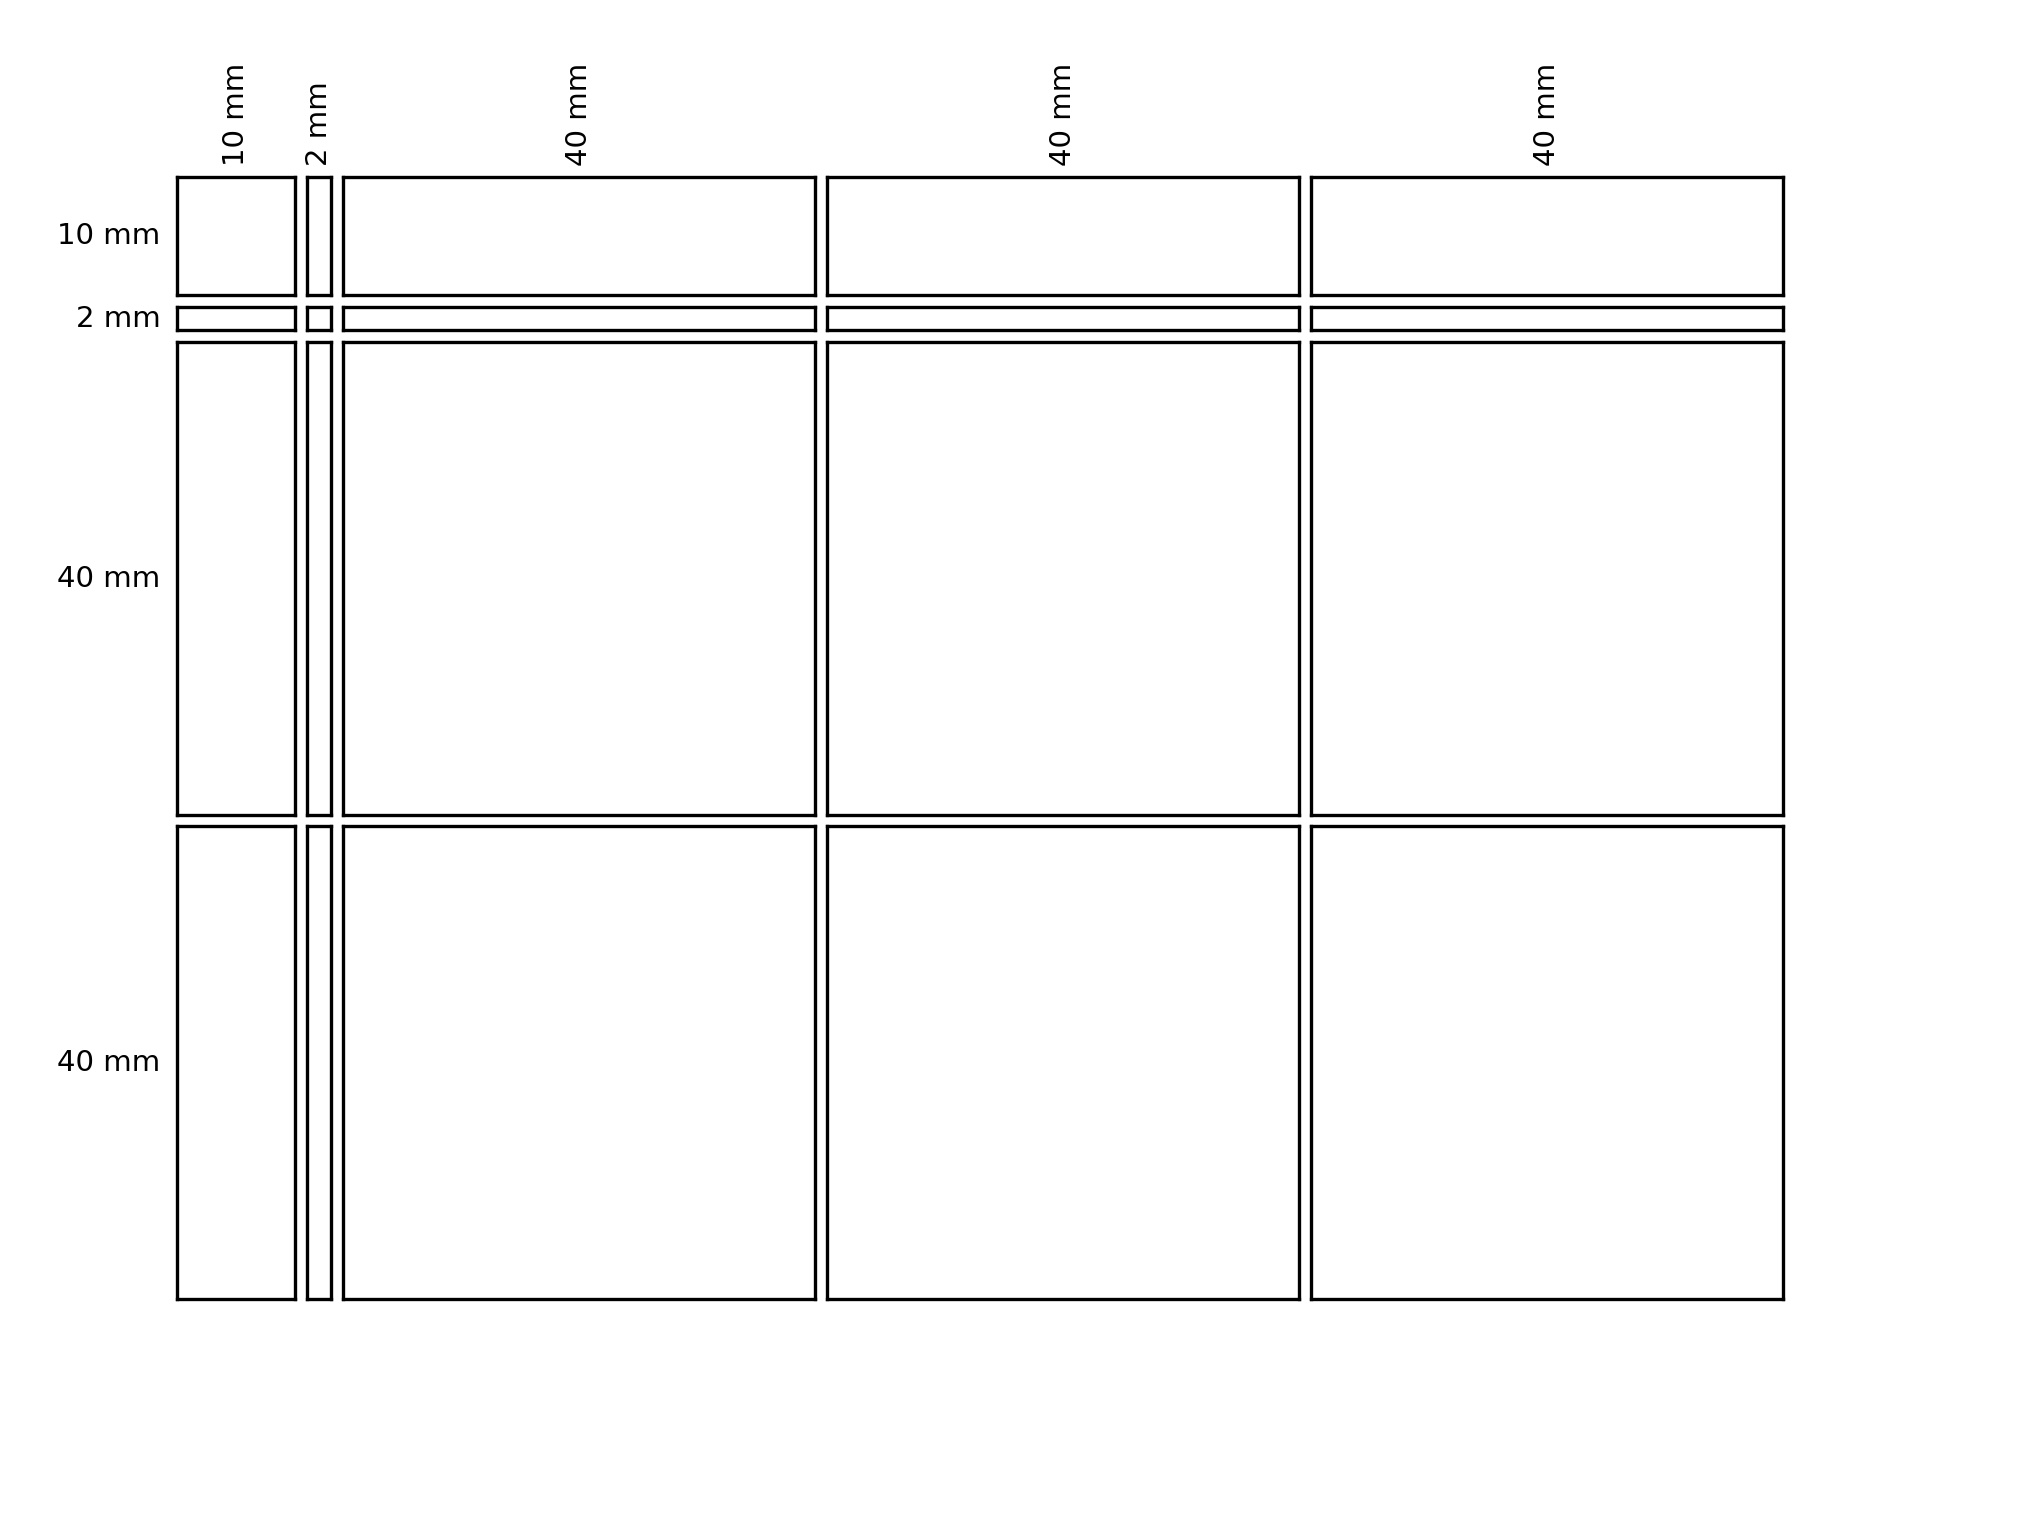
The above plot shows a figure layout created with the hmap’s layout subpackage.